Identify Data Sources |
Data undergoes the ETL process and is loaded in a Dat Warehouse

BI Analysts and/or other analytics professioinals and busienss users run analytical queries against the data.
The query results are built into datat visualizations, dashboardrs, reports and online portals

Business executives and workers use the information for decision-making and strategic planning

Key Topics
➜ Introduction to BI: Purpose, scope, and application
➜ Data warehousing and data modeling basics
➜ ETL (Extract, Transform, Load) processes
Learning Resources
➜ Books: Competing on Analytics by Thomas Davenport
➜ Courses: Introduction to BI on Coursera, LinkedIn Learning, or Udemy
Tools To Learn
➜ Microsoft Power BI
➜ Tableau
Key Topics
➜ Data visualization principles
➜ Dashboard design and creation
➜ Data blending and joining
➜ Storytelling with data
Learning Resources
➜ Tableau training on the official website or Udemy
➜ Power BI’s guided learning
Hands on Project
➜ Create a dashboard tracking key business metrics (sales, customer satisfaction, etc.)
Key Topics
➜ Statistical analysis and data mining
➜ Predictive analytics techniques
➜ Understanding and using machine learning algorithms
Learning Resources
➜ Data Science for Business by Provost & Fawcett
➜ Kaggle: Practice predictive analytics challenges
Hands on Project
➜ Create a dashboard tracking key business metrics (sales, customer satisfaction, etc.)
Tools To Learn
➜ Python or R for data analysis (with libraries like pandas, scikit-learn)
➜ SQL for querying databases
➜ Tableau or PowerBI for advanced analytics
Key Topics
➜ The role of AI in BI and analytics
➜ Automating ETL processes using AI
➜ Natural Language Processing (NLP) for querying and reporting
➜ Predictive and prescriptive analytics using AI
Learning Resources
➜ Coursera: AI in Business Analytics specializations
➜ Fast.ai for practical AI
➜ OpenAI’s GPT models and integration with BI tools
Tools To Learn
➜ Microsoft Azure AI or Google AI platform
➜ Python (AI-focused libraries such as TensorFlot, PyTorch)
➜ Power BI w/ integrations, Tableau's AI features
Hands on Project
➜ Build AI-powered dashboards (e.g., sales forecasting using machine learning)
Key Topics
➜ Automating reporting and alerts
➜ Real-time data processing using AI
➜ Self-service BI for non-technical users
➜ The role of conversational AI and voice-enabled BI tools
Learning Resources
➜ Books: The Rise of AI-Powered BI
➜ Platforms: Microsoft Power Automate, Tableau’s Ask Data feature
Hands on Project
➜ Create self-service dashboards with real-time data analytics
Key Topics
➜ Ethical considerations in AI-driven BI
➜ Data privacy, governance, and compliance
➜ Future trends in BI: Augmented Analytics, AI-driven decision-making
Learning Resources
➜ Books: Weapons of Math Destruction by Cathy O’Neil
➜ Articles: Gartner reports on AI and BI trends
Tools to Learn
➜ Data governance platforms (like Alation or Collibra)
➜ AI ethics frameworks (openAI resources)
Key Topics
➜ Industry-specific BI applications (e.g., retail, healthcare, finance)
➜ AI-driven predictive modeling for business strategy
Hands-On Project
➜ Build an end-to-end BI solution for an industry problem (integrating AI and automation)
➜ Stay updated with AI and BI trends via conferences, blogs, and communities.
➜ Certifications:
➜ Tableau Desktop Certified Professional
➜ Microsoft Power BI Data Analyst
➜ Google Cloud AI or Azure AI certifications
Hands-On Project
➜ Build an end-to-end BI solution for an industry problem (integrating AI and automation)
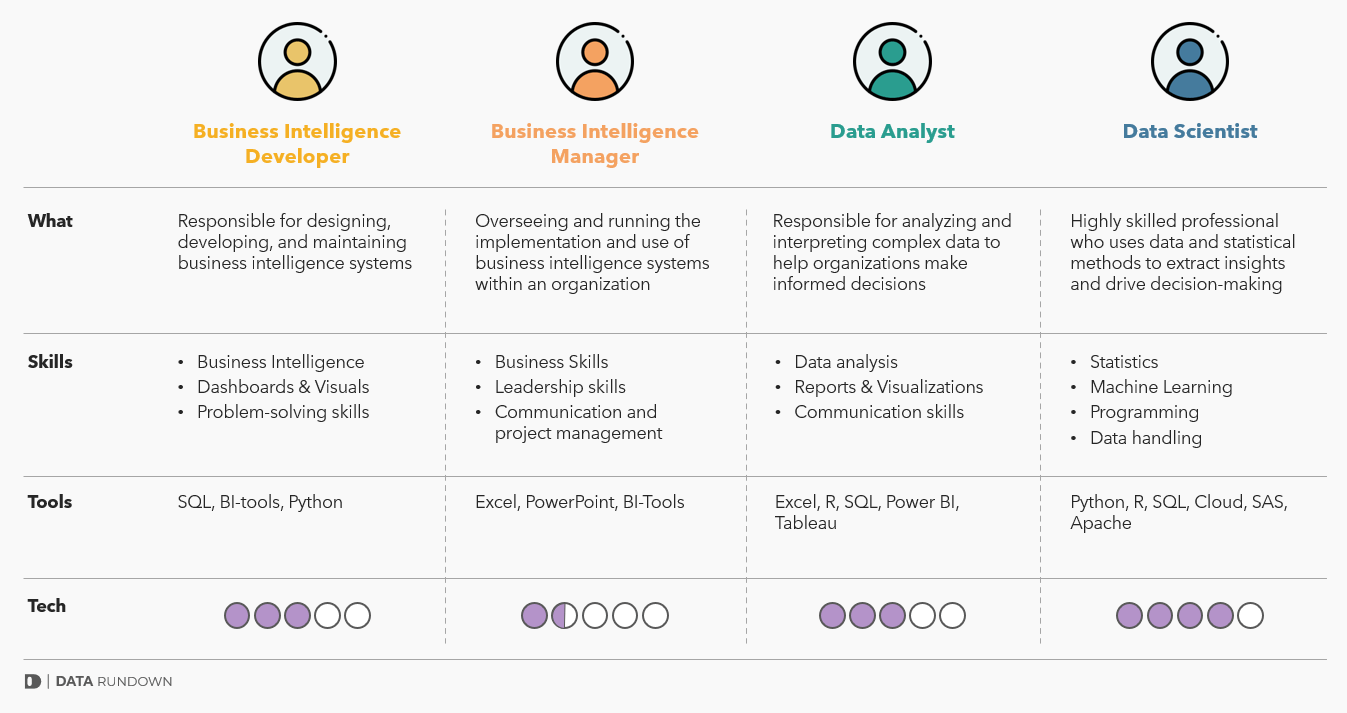
Entry-Level BI Analyst or Data Analyst
• Focus on gaining practical experience in data analysis, reporting, and visualization.
Key Responsibilities
• Work with datasets, build dashboards, and generate insights for decision-making.
• Master data visualization tools (Tableau, Power BI).
• Get comfortable with SQL for data extraction.
• Gain experience with ETL processes (Extract, Transform, Load).
Certifications:
• Tableau, Power BI, or other popular visualization tools.
• SQL courses to strengthen your data management skills.
Supplementary Courses:
• Take online courses in statistics, business fundamentals, and introductory programming (Python or R).
➜ Transition to BI Specialist or Senior BI Analyst:
Take on more responsibility by managing complex data projects and collaborating with business units.
➜ Focus on:
Building advanced dashboards, improving data processes, and working with stakeholders to understand business needs.
• Advanced data visualization and storytelling techniques.
• Data modeling and predictive analytics skills.
• Develop business acumen: Gain deeper knowledge of business processes, especially in industries of interest.
Certifications:
• Consider a certification in data science or predictive analytics to increase your analytical skill set.
Courses:
• Take advanced courses in data modeling, statistics, and machine learning.
• Consider a master’s degree in data science, business analytics, or an MBA with a focus on business intelligence.
➜ Senior Manager or BI Team Lead:
Move into a supervisory role where you lead a BI team, oversee projects, and ensure data-driven strategies align with business goals.
➜ Focus on:
Mentoring team members, strategic project planning, and collaborating with executives to shape BI strategy.
• Leadership and management skills: learn to lead and develop a team.
• Strategic planning and business strategy alignment: ensure BI efforts support larger organizational goals.
• Develop strong communication skills to articulate data-driven insights to non-technical stakeholders.
Certifications:
• Look into certifications for leadership in data (e.g., Certified Analytics Professional, CAP).
Courses:
• Enroll in courses on strategic management, data governance, and executive data storytelling
• Executive Education Programs: Consider shorter executive programs in BI, strategy, or data-driven leadership from top business schools.
➜ Director of Business Intelligence
Oversee BI strategy, manage BI teams, and collaborate with cross-functional leaders to enhance the organization’s data maturity and decision-making processes.
• Strong expertise in BI strategy development and execution.
• Excellent understanding of data governance and data ethics.
• Ability to align BI initiatives with business strategy and financial goals.
Ongoing Executive Programs:
• Keep updated with developments in AI, data science, and BI strategy through workshops and conferences.
Networking and Mentorship::
• Connect with industry leaders and potential mentors in BI and data strategy to stay on top of trends and leadership practices.